Best Smart Ring: SLEEP 💤
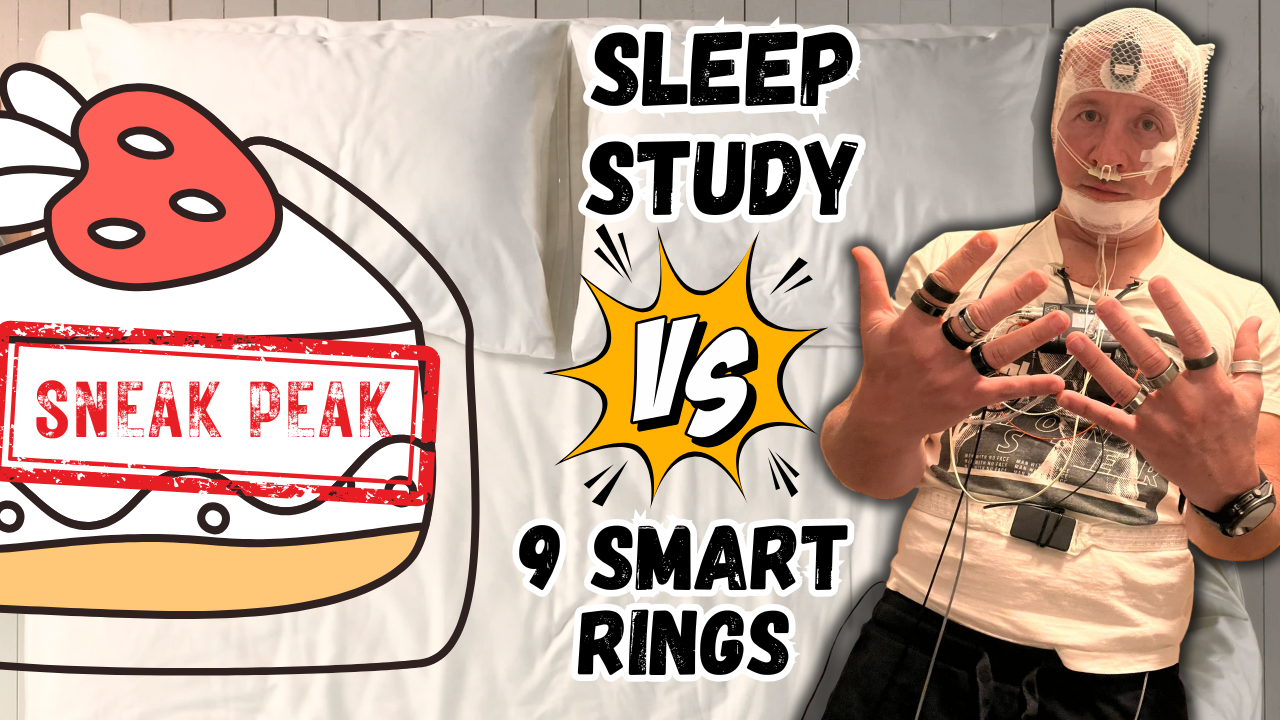
Which smart ring measures sleep best? I spent a night in a sleep lab to compare the sleep tracking accuracy of the top models against the gold standard—polysomnography (PSG). How did Oura, Samsung, Ultrahuman, and others perform? The results might surprise you!

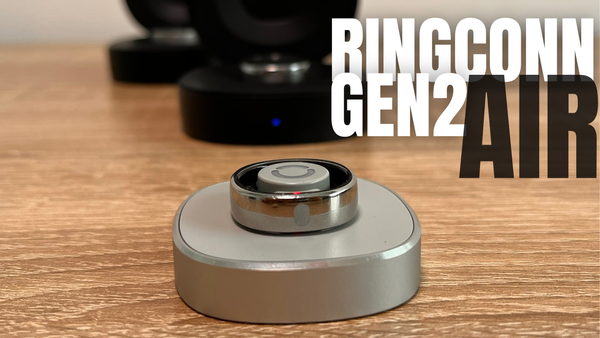
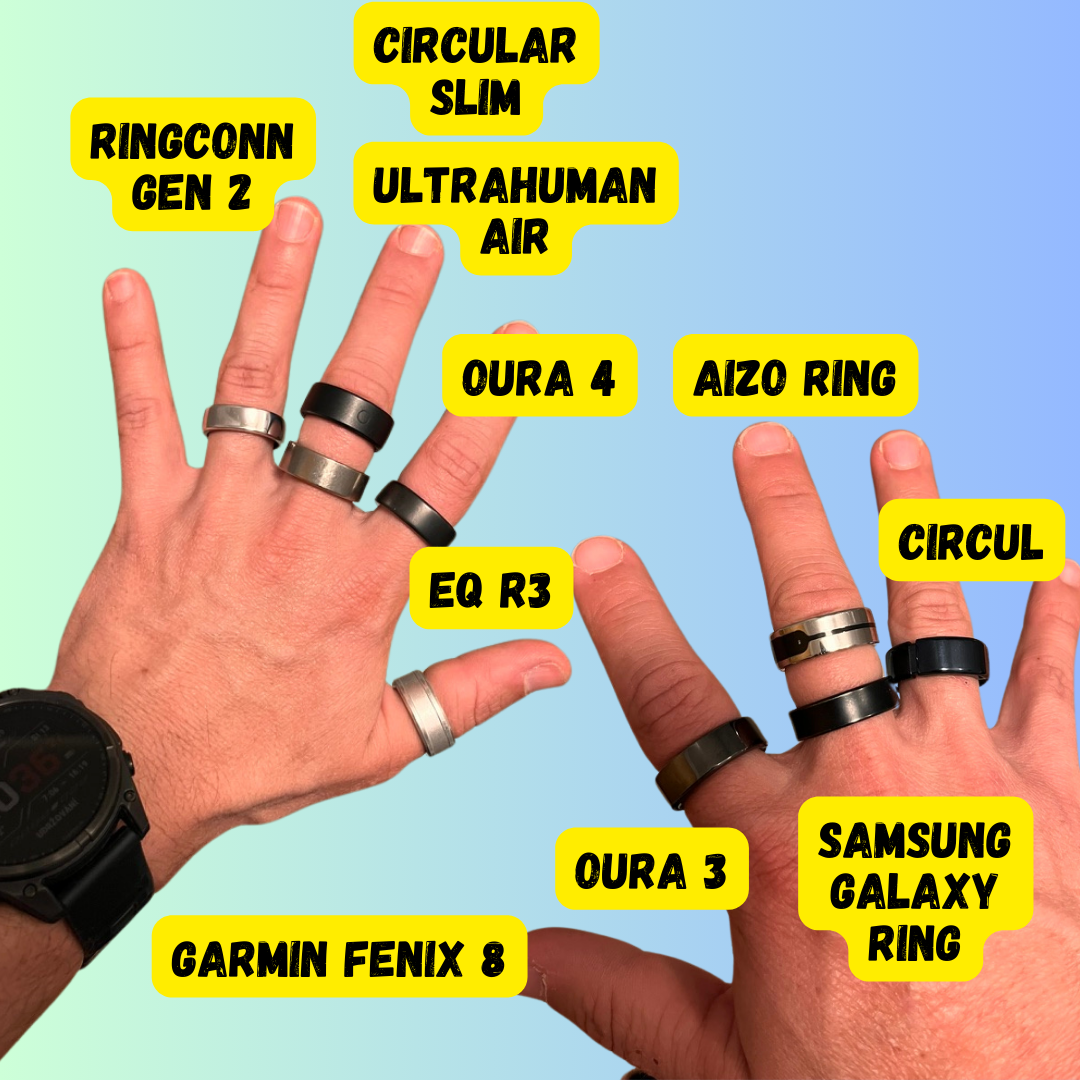
I spent a night in a sleep lab to test how accurately smart rings measure sleep compared to polysomnography (PSG). I brought along all my precious—Oura 3, Oura 4, Ultrahuman Air, Samsung Galaxy Ring, Circular Slim, Circul, RingConn Gen2, EQ R3, and as a bonus, the new Garmin Fenix 8 watch.
The prequel to this article was a look at the summary data of sleep stage durations.
If you haven’t read it, here’s the key takeaway:
- Oura Ring 4 and Samsung Galaxy Ring performed very well.
- Total time in each sleep stage isn’t enough. Even if a ring correctly estimates the duration of deep sleep, it might not pinpoint the exact time it actually occurred.
In this article, you’ll learn:
- 🥼 What happens during a night in a sleep lab.
- 🔭 How sleep stages are actually determined.
- 📱 How to export data from smart ring apps.
- 🌗 How smart rings perform using a 2-stage model (sleep vs. wake).
- 📉 How they compare in the 4-stage model (hypnogram, confusion matrix).
- 🏅 Which device had the most accurate measurements?
- 🤔 What’s the final verdict?
To navigate quickly, click on the chapter that interests you ⤴️. However, for full context, I recommend reading the entire article.
Let’s dive in! 💥
🥼 Sleep Lab: How Is Sleep Measured?
If you suspect a sleep disorder, your primary care doctor can refer you for an overnight study at a sleep lab. After scheduling an appointment, you’ll arrive at the facility in the evening, where a team of specialists will attach various sensors to your body. These sensors monitor your brain waves, eye movements, muscle activity, heart rate, and breathing throughout the night.
The process of attaching all the electrodes and straps isn’t exactly pleasant—it takes some time, and you might feel a bit like a cyborg. It’s not the most comfortable way to sleep, either, since you’re covered in wires, bands, and electrodes, which is far from a typical bedtime setup. If you tend to toss and turn at night, it can be quite bothersome.
The "fun" continues in the morning when it’s time to remove all the sensors. Some come off easily, while others provide an unexpected (but free) partial depilation. Once everything is off, you can take a shower to wash away the conductive gel. Then, you head home and wait for the results and a consultation with a specialist.
Overall, it’s not the most comfortable night, but if you suspect sleep issues, it’s definitely worth doing.

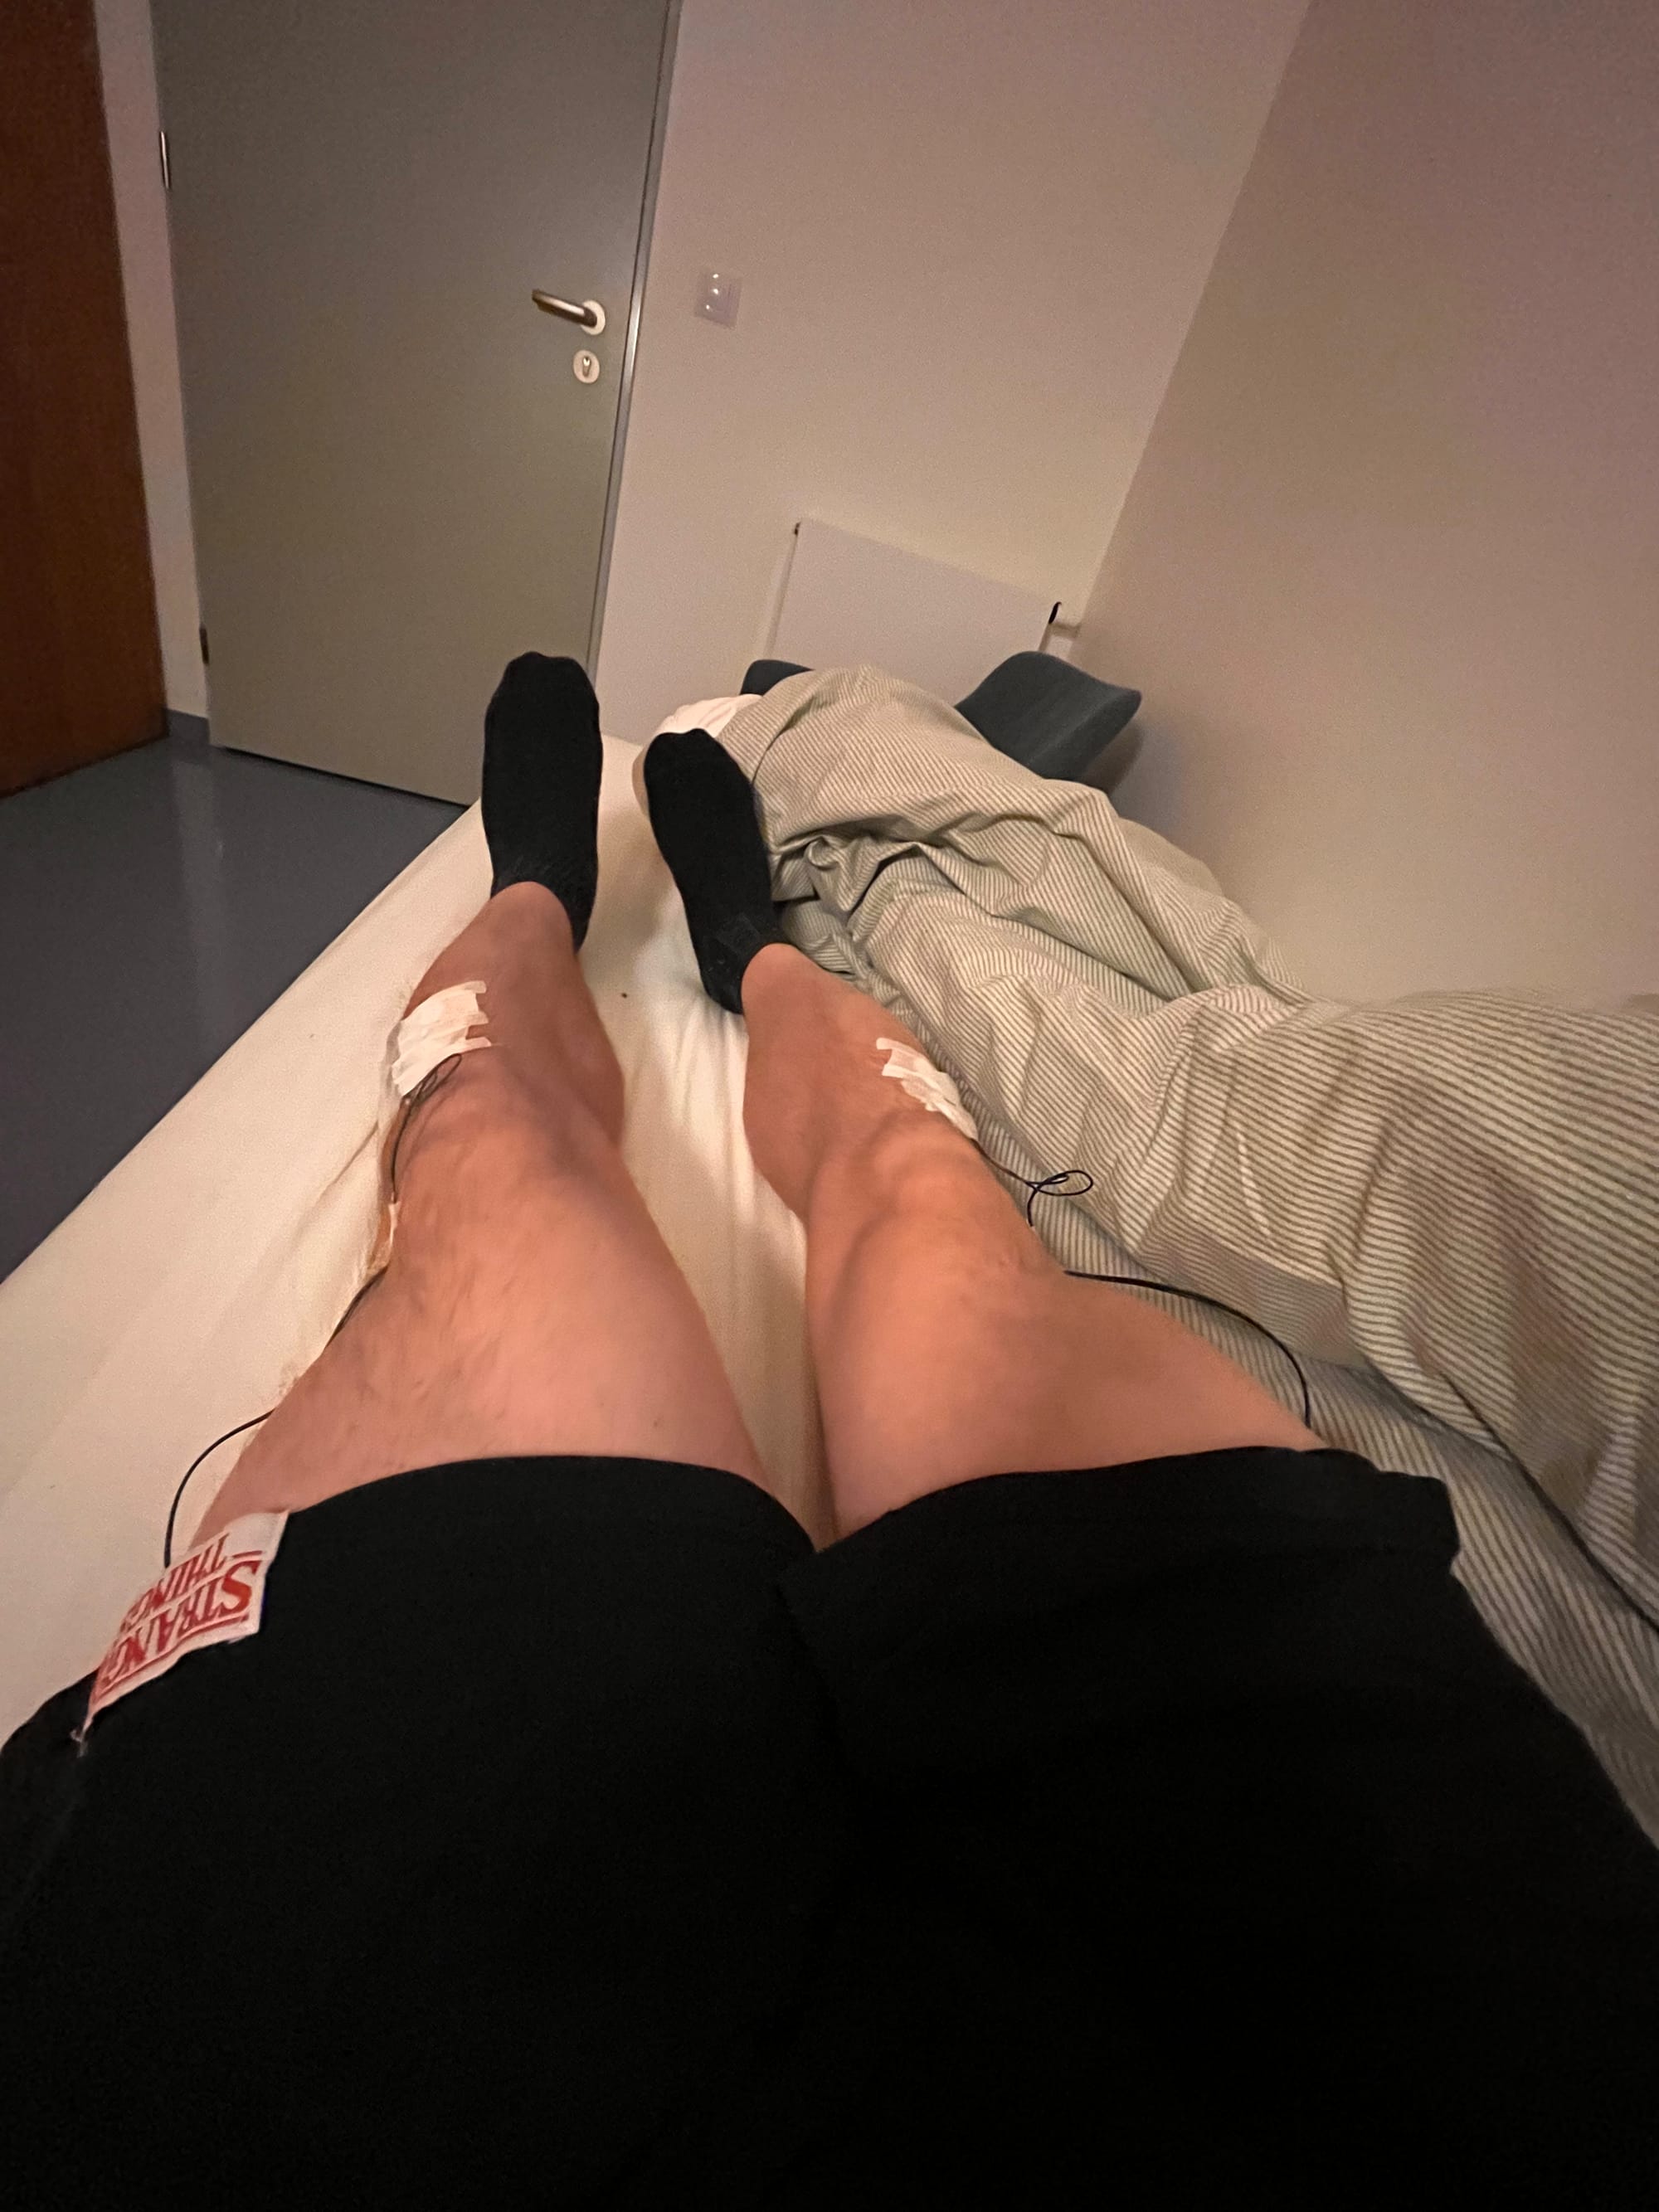
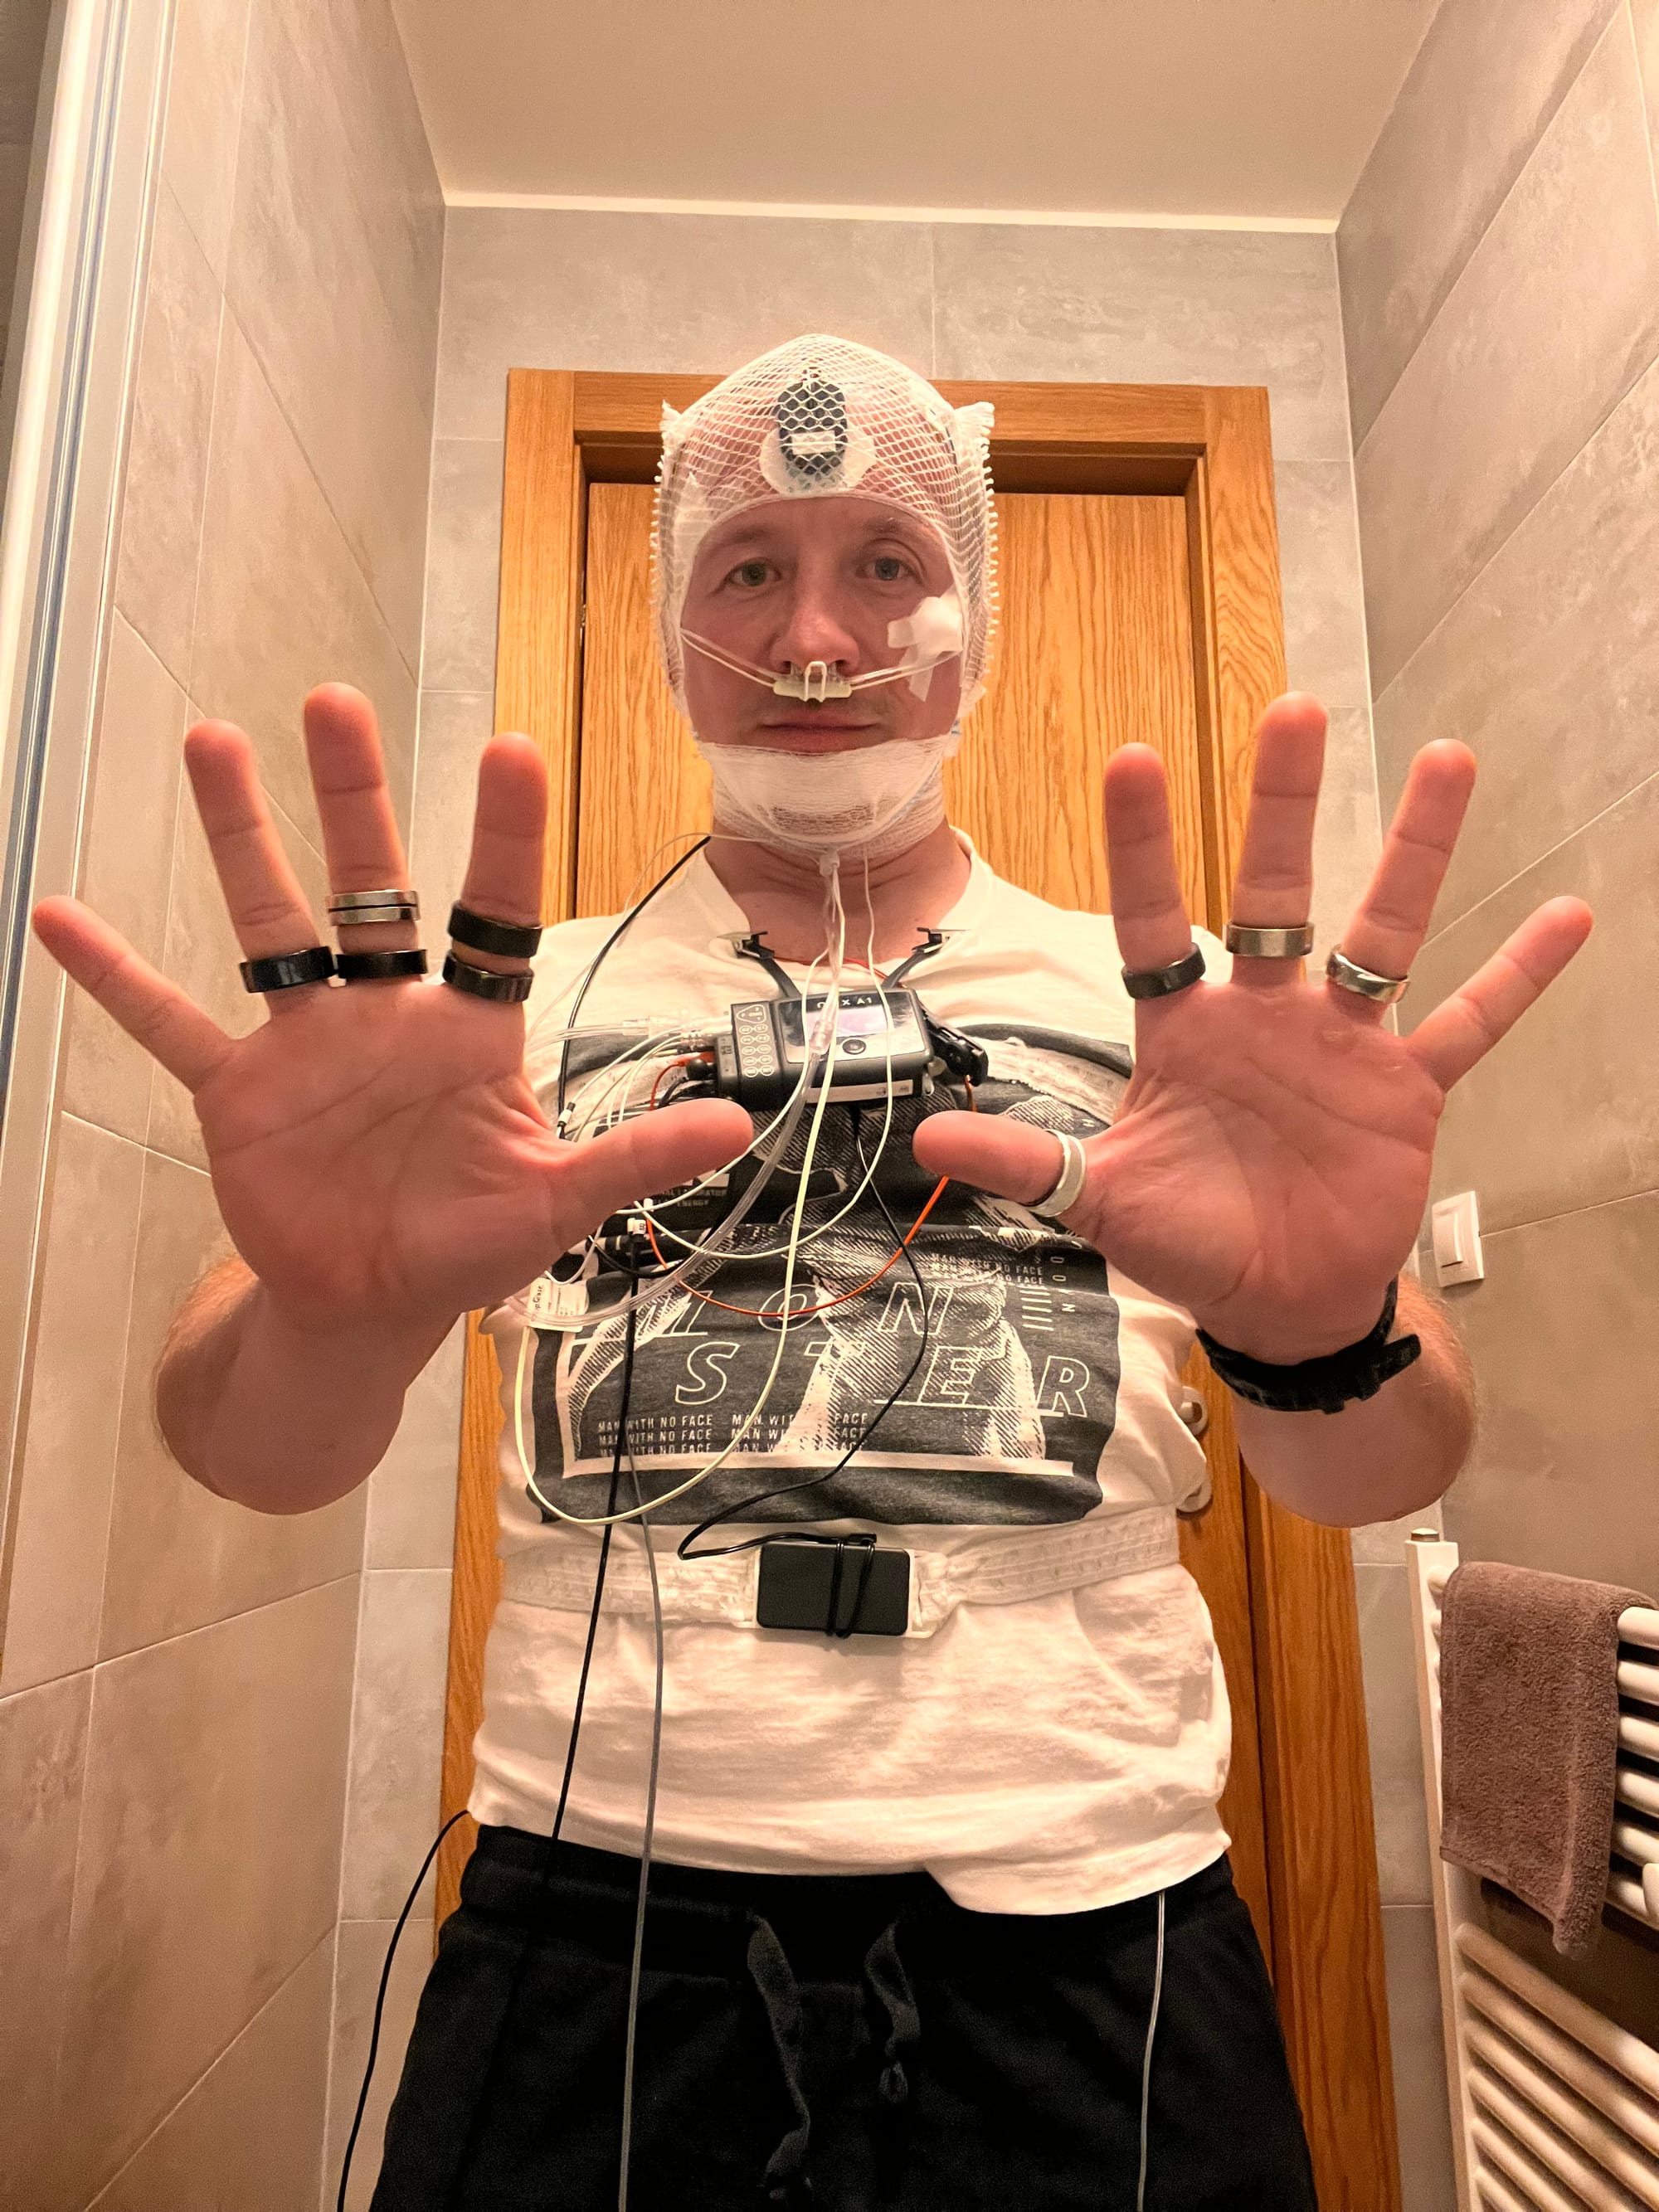
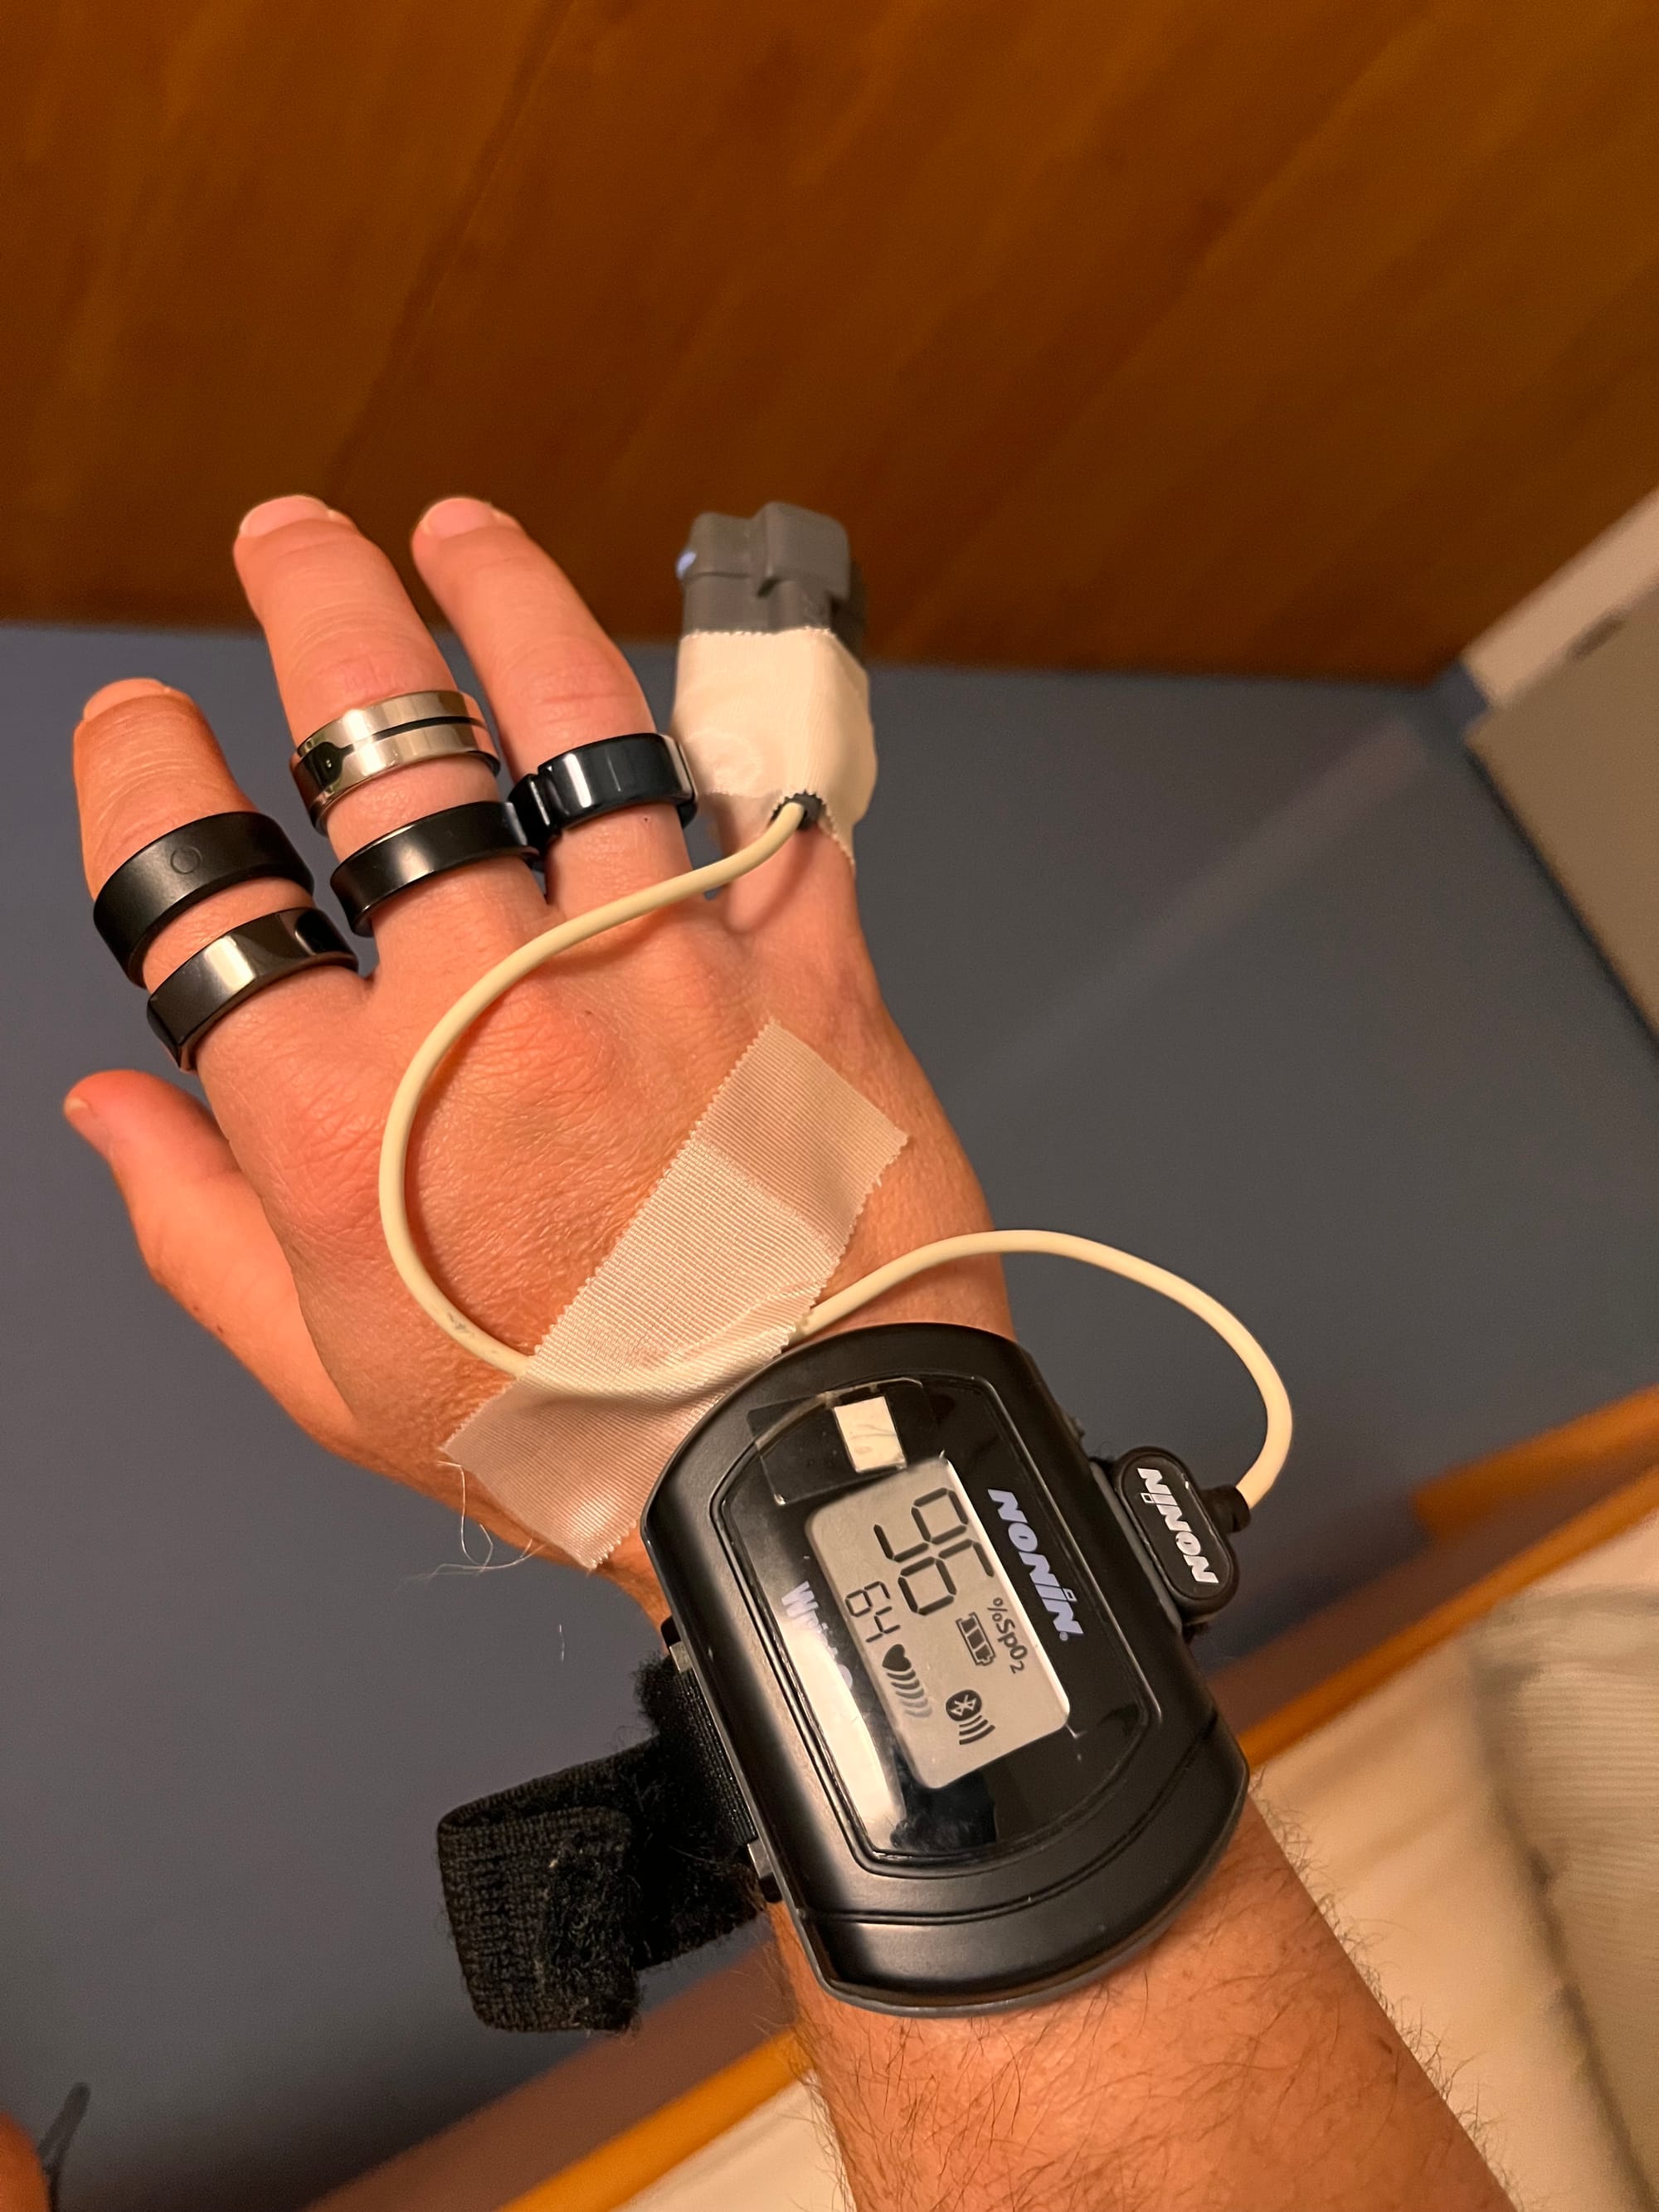
Evening Gallery: Beer (an important detail, as you’ll soon find out), rings, feet, the ring-covered cyborg, and a close-up of a medical oximeter.
🥼 How Are Sleep Stages Determined?
Most smart devices categorize sleep into four main stages: wake, light sleep, deep sleep, and REM sleep. But how are these stages identified in a sleep lab?
Polysomnography: The Gold Standard for Sleep Measurement
A sleep lab uses polysomnography (PSG) to monitor various physiological signals:
🔹 EEG (Electroencephalography) – records brain activity
🔹 EOG (Electrooculography) – tracks eye movements
🔹 EMG (Electromyography) – measures muscle tension
🔹 PPG or ECG – monitors heart activity and breathing
💍 How Do Smart Rings and Watches Track Sleep?
Wearable devices like smart rings and watches don’t have EEG capabilities, so they rely on different data sources:
🔸 Heart rate variability (HRV)
🔸 Changes in heart rate throughout the night
🔸 Body movements (accelerometer)
These devices use machine learning algorithms to estimate sleep stages based on these metrics. Since it's an indirect measurement, the goal is to get as close as possible to the accuracy of polysomnography.
⛏️ Mining Sleep Data: How to Export Sleep Data from Smart Rings
A huge thanks to the sleep lab (which preferred to remain anonymous) for providing reference data from my experimental night. This gave me a solid benchmark for comparison.
But getting data from smart rings? That was a whole different challenge! And it made me wonder—how much do I really own my own wearable data? If an app only shows you a hypnogram image without exact timestamps, that’s not enough.
So, how did different platforms handle data exports? Let’s find out!
| Device | API / Data Export | Rating |
|---|---|---|
| Oura Ring (Oura 3 & 4) | Great API, data can be downloaded via GET in Postman | 👍 |
| Ultrahuman Air | Excellent API, support helped with setup | 👍 |
| RingConn Gen2 | Allows export, but not detailed enough. Had to manually transcribe. | 👍👎 |
| Circular Slim | No API, manual data extraction was even more painful than RingConn | 👎 |
| EQ ECTRI | No export option, manual transcription only | 👎 |
| Samsung Galaxy Ring | API is internal, data not visible in the app. Workaround: transfer data to Sleep as Android. | 👎 🤬 |
| Circul | Impossible to extract data. | ❌ |
| Aizo | Data mysteriously disappeared. | ❌ |
| Garmin Fenix 8 | Manual reading from Garmin Connect | 👎 |
📊 How Do Smart Rings Perform in the Two-Phase Sleep-Wake Model?
We have both reference data and smart ring outputs—now it’s time for analysis. We’ll start with a broad overview and gradually dive deeper into the details.
🔍 The Simplest Sleep Classification: Two-Phase Model
The most basic method of sleep analysis divides the night into just two states: sleep vs. wakefulness (awake/wake phase).
📌 How to Interpret the Results?
Each device detects sleep onset and wake-up differently—some recognize the initial wake phase, while others skip the transition entirely. These variations can also affect wake detection in the morning. To ensure fair comparisons, I manually adjusted the final wake phase across all devices to match uniform conditions.
📌 Why Is the Two-Phase Model Important?
Many sleep tracking platforms use Total Sleep Time (sleep duration minus wake phases) as a key input for further calculations. It influences sleep scores, readiness scores, and other key metrics. Even small differences in detection can significantly impact the final results.
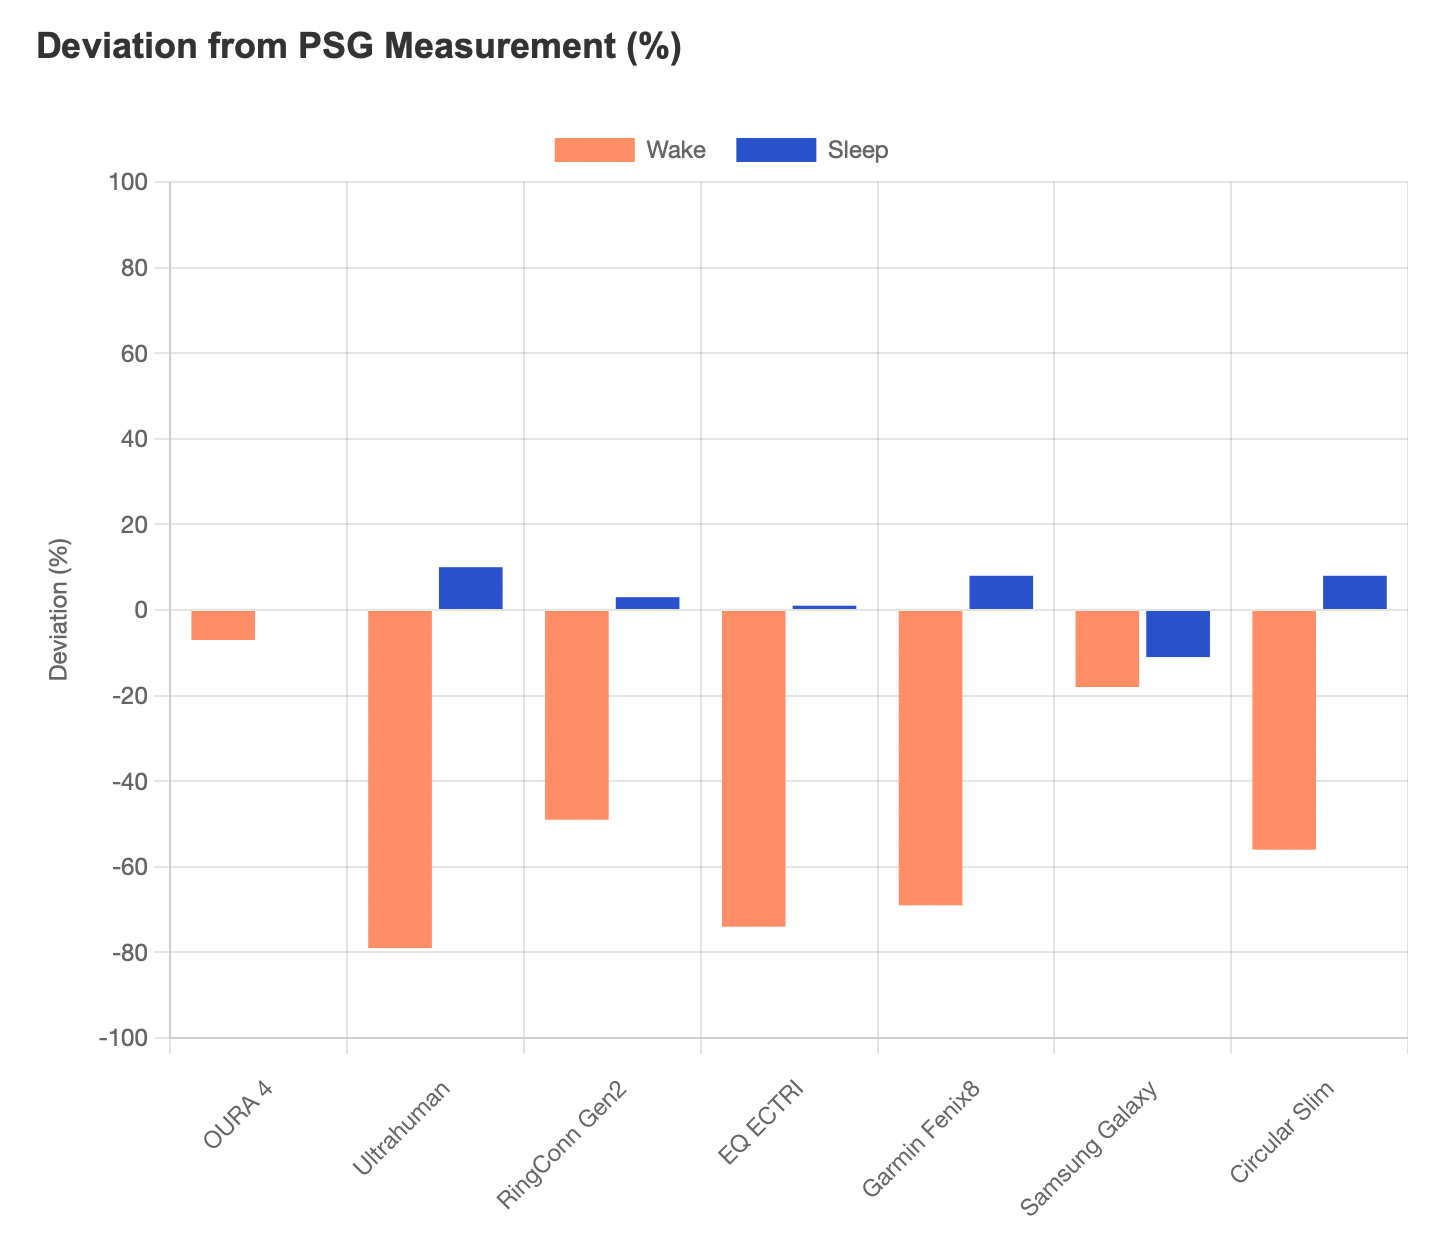
📉 How Accurately Did Smart Rings Track Sleep?
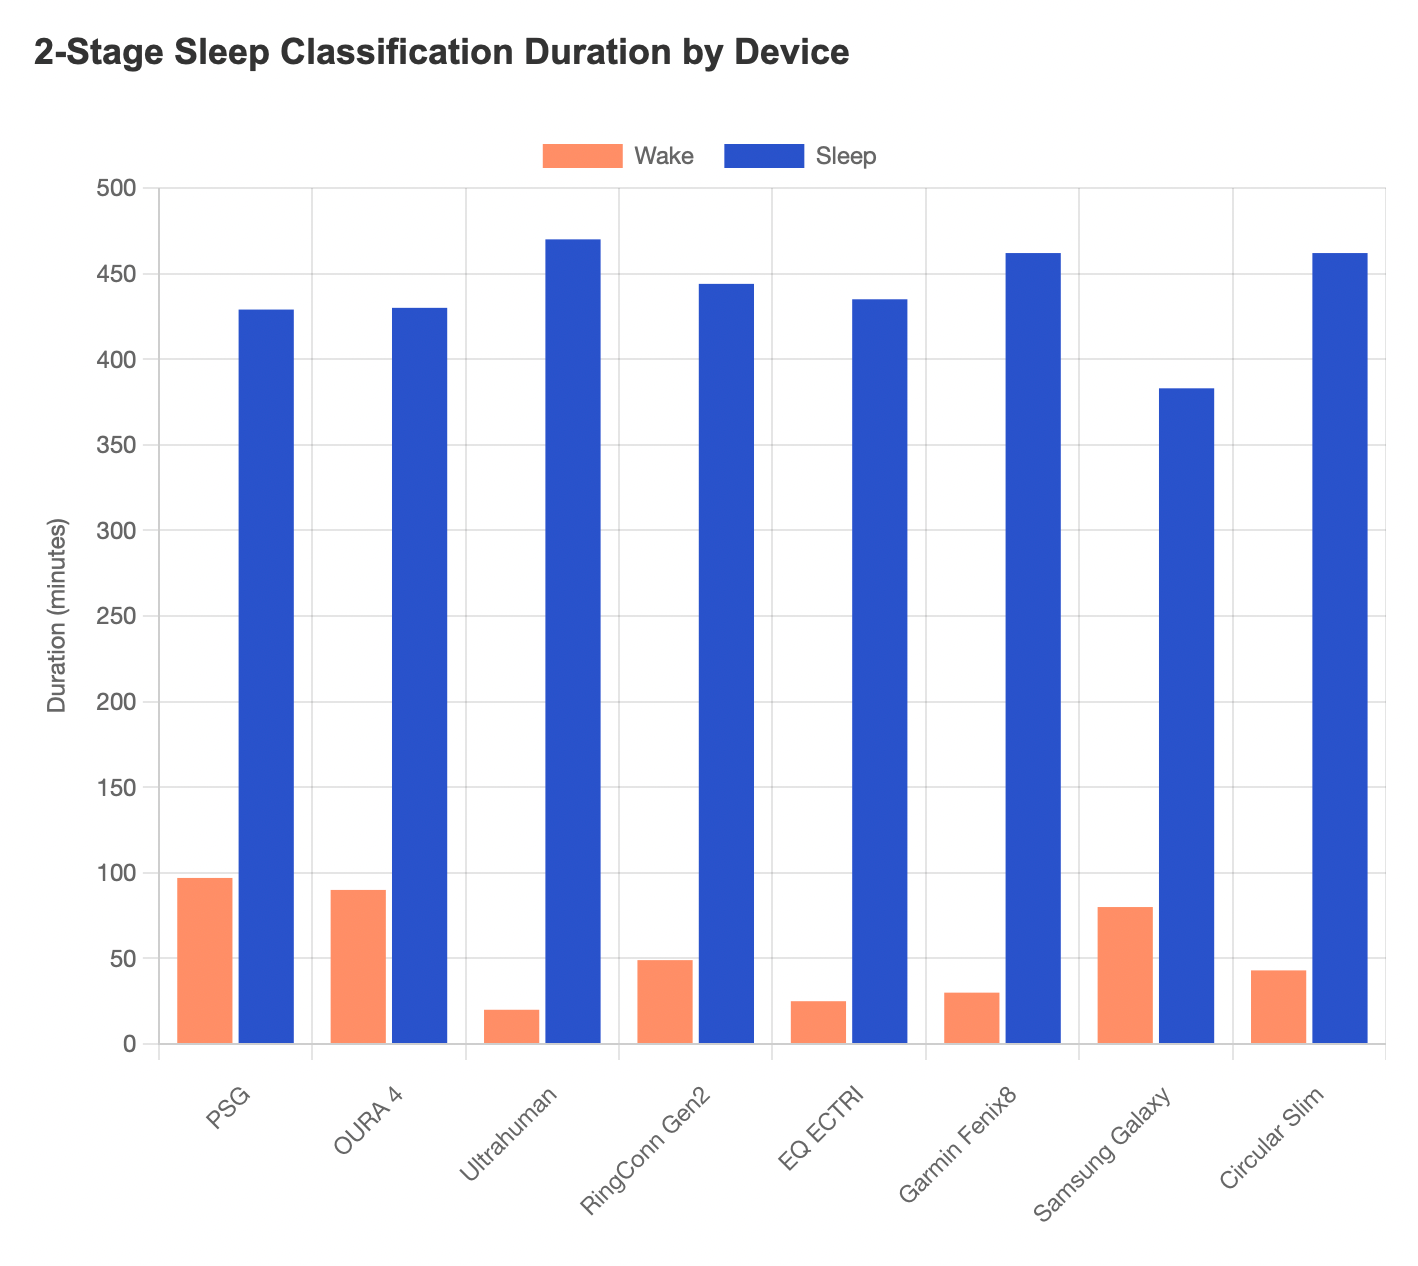
Let’s examine how much the results vary across different devices. Below, you’ll find a graphical comparison of total sleep time and wakefulness measured by each platform.
The graph below compares total sleep duration (blue) and wake phases (orange) across reference PSG data and the tested smart rings.
The following graph illustrates the deviation of each device from the PSG reference value in percentage terms.
• Negative values indicate that the device underestimated the wake phase (detected fewer awakenings than actually occurred).
• Positive values mean the device overestimated the wake phase (detected more awakenings than there actually were).